
Area and production of crops
Agricultural Statistics
Data visualization and Analytics on area, production and productivity of crops and land utilisation pattern in Kerala
Visualisation Gallery
Gallery of crops and data visualisation
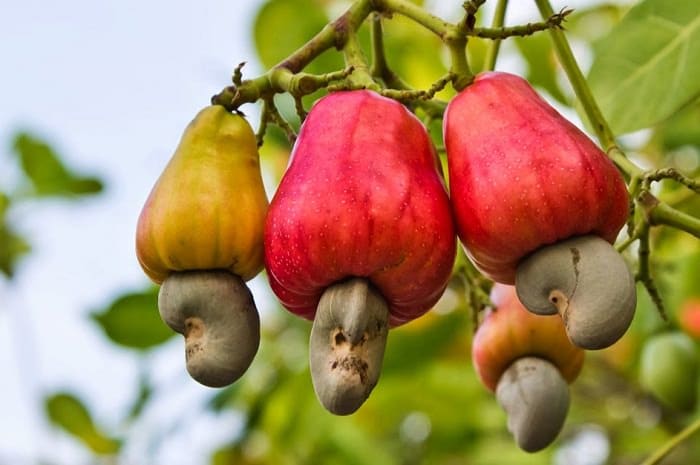
Cashew
Cashew cultivation is seen in all districts in the State
Trend of Area and Production of Cashew in Kerala
>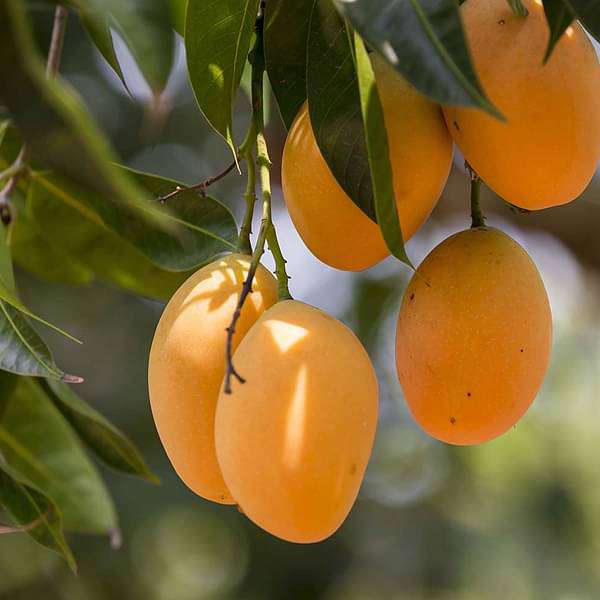
Mango
Mango is another very important fruit crops in Kerala and is seen in all districts
Trend of Area and Production of Mango in Kerala
>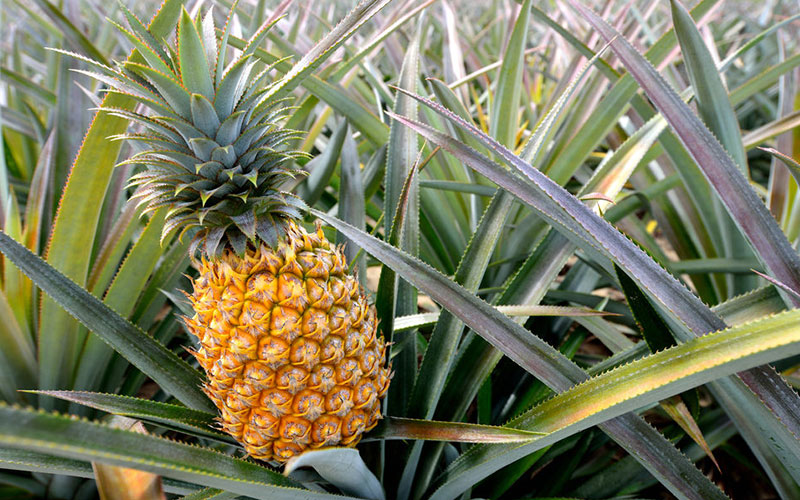
Pineapple
Pineapple cultivation is mainly concentrated in central districts, mainly in Moovattupuzha in Ernakulam district
Trend of Area and Production of Pineapple in Kerala
>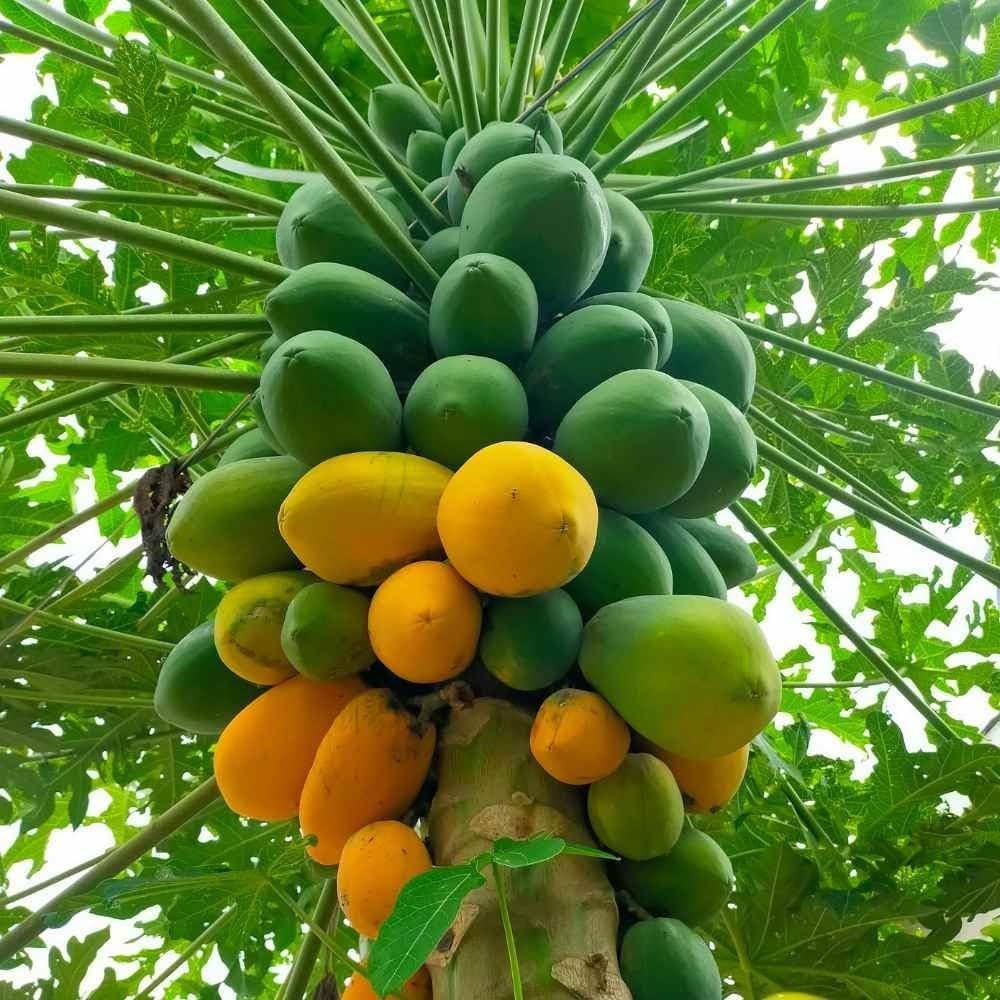
Pappaya
Papaya is medicinal fruit and is cultivated all over the State
Trend of papaya cultivation in Kerala
>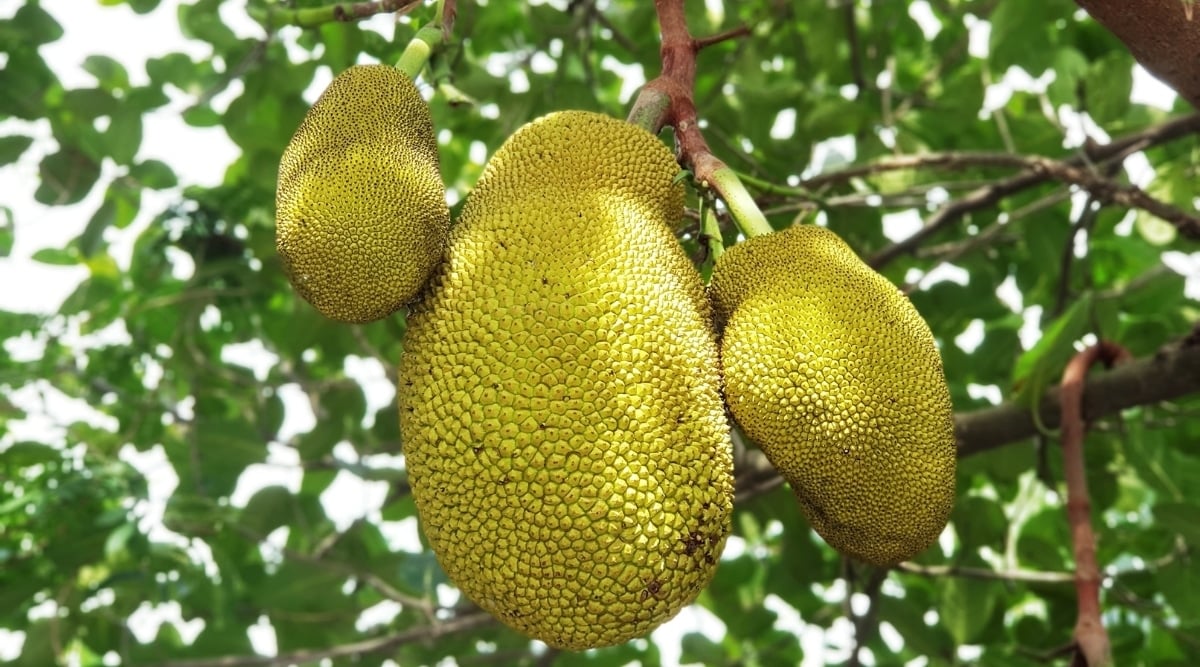
Jack
Jack fruit trees are everywhere in Kerala. It is used for the preparation of many value-added products jam, squash, ice cream etc
Trend of Area and Production of Jack in Kerala
>More Enquiry and Analytics
More than 200 reports on agriculture statistics, which were published the Department of Economics & Statistics, are available in the official website. The data on all these reports are now available in the fingertip. Lot of analytics and open datasets on agricultural statistics are also available in the website. To get details on each, the following links may be visited.
Reports on crop statistics
Department of Economics & Statistics is estimating area, production and productivity of principal crops and land utilisation pattern annually under the scheme EARAS.
All analytics and charts
All charts and graphs analysing the area, production and productivity and land utilisation pattern in Kerala.
Area and production of crops at State level
State level aggregates of Area, production and productivity of principal crops published by the Department of Economics & Statistics from 1952-53
District wise Area and production of crops
District wise Area, production and productivity of principal crops published by the Department of Economics & Statistics from 1952-53
State level land utilisation
State level classification of land according to its utilisation published by the Department of Economics & Statistics from 1952-53
District wise land utilisation
District wise classification of land according to its utilisation published by the Department of Economics & Statistics from 1952-53
State level cropping intensity
State level cropping intensity published by the Department of Economics & Statistics from 1952-53
District wise cropping intensity
District wise cropping intensity published by the Department of Economics & Statistics from 1952-53
All Datasets on Agriculture Statistics
All datasets on area, production and productivity of principal crops published by the Department of Economics & Statistics
Area, Production and Productivity
Crop Enquiry Tables
Area, production and productivity statistics in Kerala
This is a trend chart of area and production of selected crops for all agriculture years. For the best view of the chart, select "Any Agriculture year", choose one district and one crop.
District wise area- Bart Chart visualisation
For best viw of district wise bart chart, select one year, all districts and one crop at a time.
District wise proportion of area under different crops- Pie Diagram
Choose a year, all districts and one crop to display the pie chart properly.

Cropping intensity in Kerala
CROPPING INTENSITY
Cropping intensity is the number of times a crop is planted per year in a given agricultural area. It is the ratio of effective crop area harvested to the physical area.
CROPPING INTENSITY
Here the chart provided is a trend chart. So, select all years or more than one year and select one district to display the trend chart.
Cite This Article
Data and interpretations on this online document may have been sourced from one or more Publications or data sets of the Department of Economics & Statistics, Government of Kerala. . When citing this article, please also cite the underlying data sources. This article can be cited as:
Director of Economics & Statistics 1950 to 2021 Agricultural Statistics May 2024 https://www.ecostat.kerala.gov.in/

This page has been viewed 26064 times.